Visualize warehouse travel
Travel is the greatest source of wasted labor in a typical warehouse. This tool computes the shortest path required to visit an arbitrary set of storage locations.
What does this program do?
This program computes and displays the shortest path necessary to retrieve all the SKUs requested by a customer. This enables you to:
- Visualize the patterns of customer orders by seeing your sales history projected onto a map of your warehouse.
- Identify “hot spots” by generating a “heat” of your storage locations from your sales history.
- Evaluate effects on travel due to alternative layouts, rack arrangements, SKU re-location, etc. by re-running your sales history through an alternative map and comparing total travel distance.
- Evaluate the effect on travel of different batching strategies, work allocation, marketing plans, etc. by re-running alternative sales histories through the warehouse map and comparing total travel distances.
- Explore whether intelligent path-planning can reduce travel to pick orders in your warehouse. (Most warehouse management systems produce pick lists that simply sort picks in the sequence in which the SKU locations would be encountered while following some natural path through the warehouse. But this may not be the shortest path because it ignores, among other things, the possibilities of backtracking.)

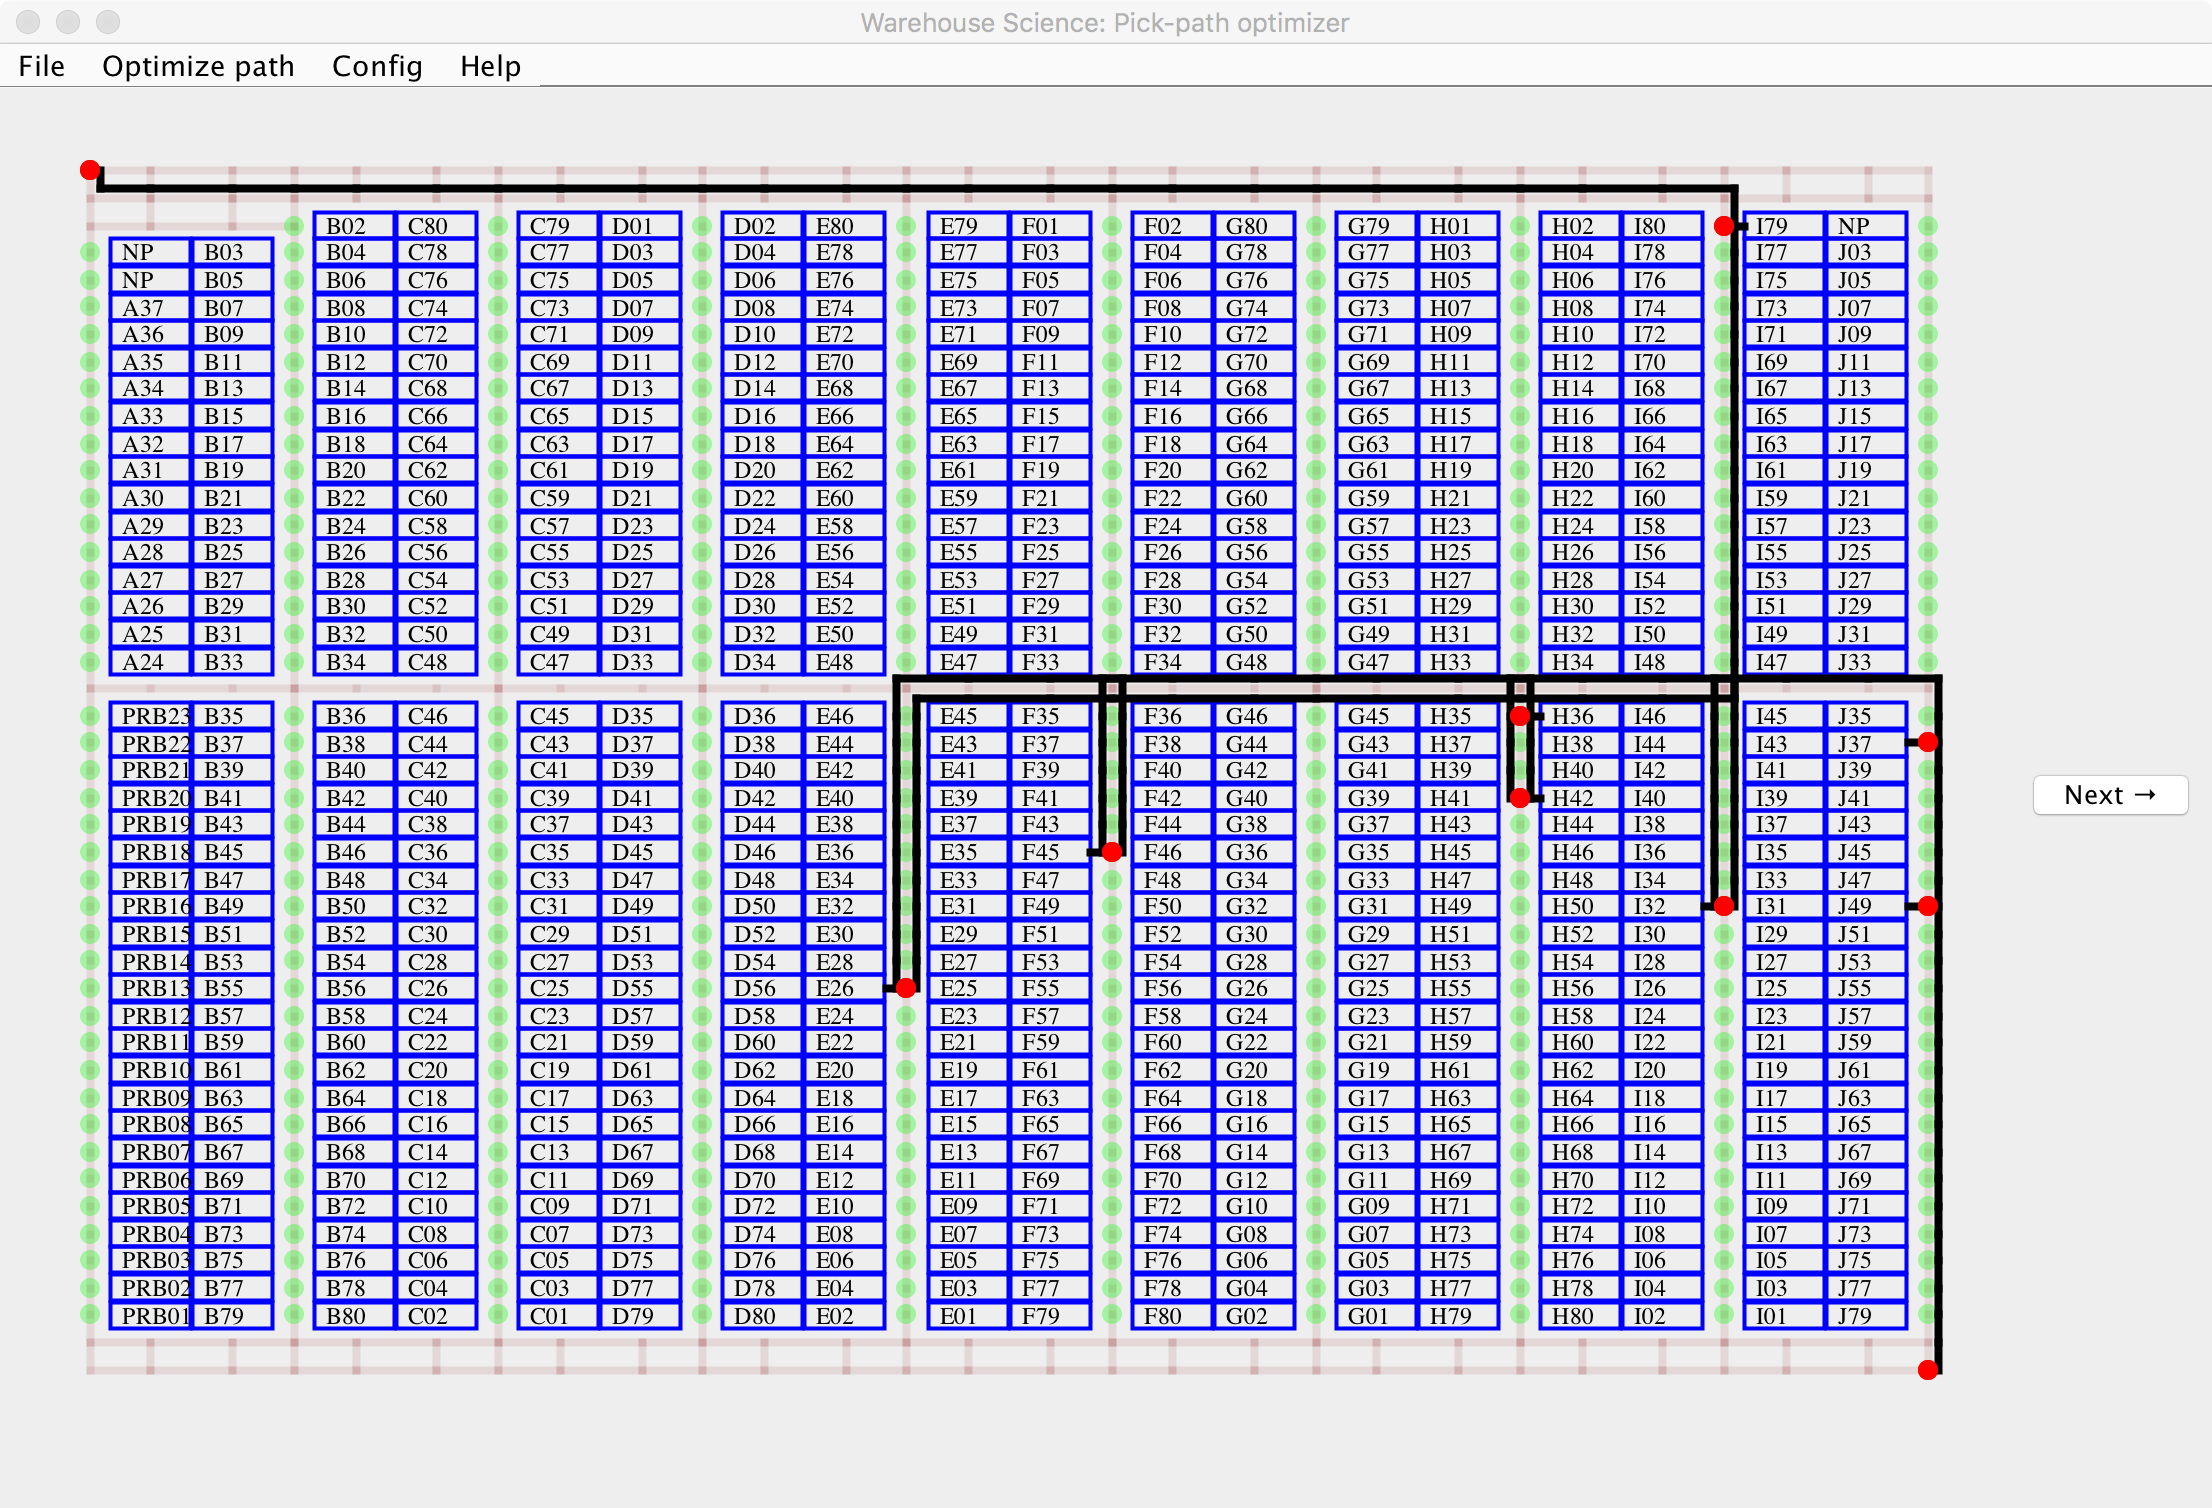
Figure 1: Shortest pick-path visiting the required (red) storage locations. In this example, all paths start at the upper left and finish at the lower right.
Use
This is a Java program and so should run on every type of machine and operating system. However, you will need to have installed Java (which is free).
If you draw the layout of a warehouse in an MS Excel spreadsheet and label the storage locations, this program will:
- Read a sales history and project each customer order onto the map to show the locations to be visited.
- Compute and display the shortest route by which an order picker can visit all the required locations most quickly.
- Report the (minimum) total distance required to retrieve one or many customer orders.
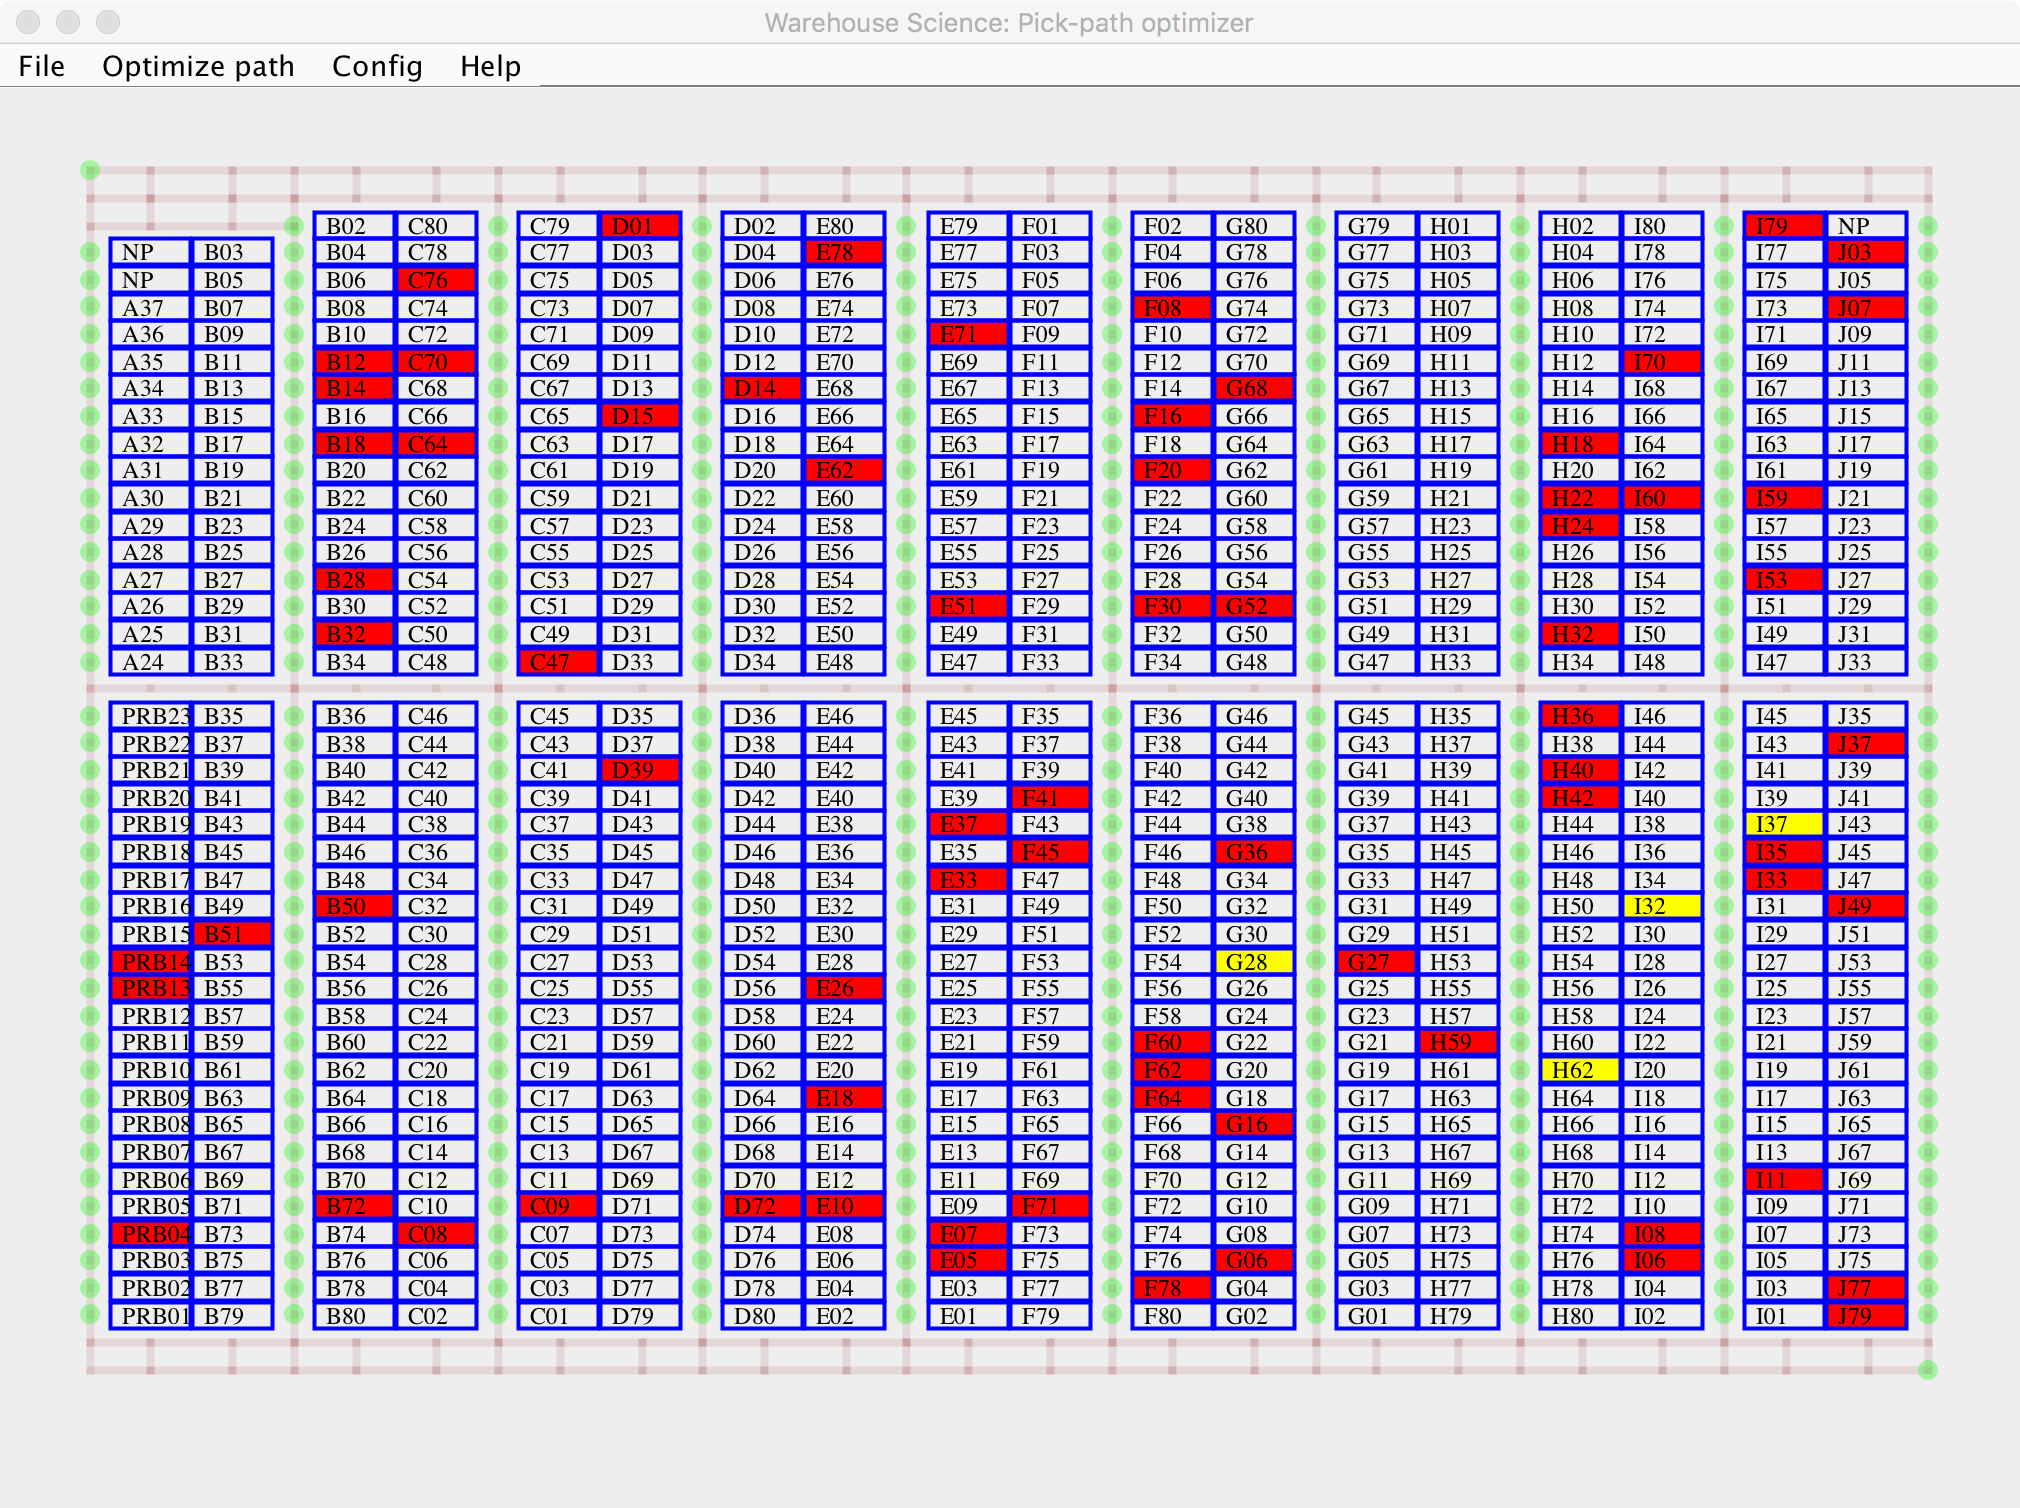
- Display a heat map showing the most-frequently visited locations.
Step 1: Prepare a map of the warehouse
The following needs to be done only once.
- Draw the map and save it on a single worksheet in
xlsxformat. In this map, each section (bay) of shelf should be represented by a cell of the spreadsheet. Each such cell should include a text string giving the unique address of that section. - In addition, all aisle space must be identified and its dimensions given. This is done by writing a text string into each cell of aisle space with the following codes:
A:to indicate Aisle space (note colon immediately following the “A”).<cell width>;, <cell length>;given in whatever coordinates you prefer (but you must be consistent). All space marked as aisle must include these dimensions.- Optional: any subset of
L,R,U, orD(separated by commas). If any space marked as aisle also includes one of these indicators, picking in forbidden in that direction (Left, Right, Up, or Down) from the cell. Note: Each storage location should be pickable from only a single direction. - Example:
A:3,2;D,Lindicates that the cell containing this string is aisle space that is 3 units wide, 2 units tall, and it is impossible to pick from any storage space that may be immediately below (D= “Down”) or immediately to the left (L= “Left”).
- Write the text string
STARTinto one cell andENDinto another to indicate the common start and endpoints of all trips by order pickers. These must be different cells, but they can be adjacent. They should not include any ofL,R,U, orDdirectives.
Step 2: Prepare a history of orders or batches
- Prepare a text file in
csvformat that lists the addresses of all storage locations visited by each order or batch. (Quantity picked is not relevant for pick-path optimization.) All the addresses of each order/batch should be listed consecutively, with each new address on a new row. Each row should contain exactly two values, the unique id of the order/batch and the address of a storage location. Do not use a header.
Step 3: Download and run the program
Please read the license and disclaimers, then click here to download the program. It will appear as a jar file, which most systems will run if you double-click on it.
If the program does not run, make sure you have the latest version of Java installed and your security settings allow execution of Java programs.
- From the top menu of the program select
FileandOpen warehouse description. The program will display an image of the warehouse (or an error message if the warehouse description contains internal inconsistencies). - From the top menu of the program select
FileandOpen batch order file. The program will pop up a menu that offers two choices:- Step through the order file one order at a time to see the optimal path; or
- Run quickly through the entire batch of orders, report the total travel distance, and display a heat map.
Here are some sample files that illustrate how to prepare your inputs.
How it works
The program relies on the Lin-Kernighan heuristic, which begins with a solution and then searches for small changes that will improve it. Strictly speaking, this can get stuck in a local optimum and so fail to find the shortest path. We reduce the chance of this happening by extending the search and by running the algorithm multiple times. You can control both of these by clicking on the menu Optimize path and then increasing the number of tries and/or number of iterations per try. Values that are too small increase the chance of a local optimum; values that are too large waste time and cpu cycles. The current values seem sufficient for most warehouses so you should probably not change current settings unless you are convinced that it is producing sub-optimal travel paths.
(We did not use the optimum-finding algorithm of Ratliff and Rosenthal, Operations Research 31(3):pp 507–521, 1983, because of the complexity of programming for warehouses with cross aisles.)
Tips
- Be careful describing your warehouse. All rows in the spreadsheet must have the same length and all columns the same width. That is, if cell E17 is labeled
A:3,2then all cells in row E in your warehouse must have vertical dimension of 2 and all cells in column 17 must have horizontal dimension of 3. - Another error that is easy to make is to have a dangling restriction, such as labeling a cell
A:3,2;Rwhen the cell to the immediate right is not a storage location. (I will improve error messages in the future.) - You must re-load the order file with each use. (Because such files can be very large, the program does not keep it in memory.)
- Write the addresses of the rack/shelves exactly the same way in both the spreadsheet map and the data file. The program will treat “B-213-18” as a different address than “b-213-18”. Also, note that the program expects to find the addresses in the spreadsheet as text. It will ignore any entry, such as “21318”, that contain only numeric characters.
- Each storage location should be accessible for picking from only one face.
- Orient your drawing so that the columns of the spreadsheet are wider than they are tall. This will leave room to write the address.

Figure 2: The most-frequently-visited storage locations
You can find more information about pick-path optimization and tools like this in our book. See especially this companion program for more control over the appearance of your heat map.
FAQ
- What if my warehouse is not a perfect rectangle?
-
No worries, as long as there is a path by which a worker could travel between any pair of storage locations.
- Can I use some other spreadsheet program?
-
Yes, you can use any spreadsheet program that can read and write files in MS Excel
xlsxformat. - Why won’t the program read my data file?
-
Did you forget to prepare it in
csvformat? - Why are the results inconsistent from one run to the next?
-
The program attempts to improve any solution by making random perturbations. If you do not specify the same initial random seed, two different runs might produce two different results. However, this should happen only occasionally and the differences should be small.
- How can I configure the program more to my liking?
-
You can prepare and load a configuration file to change any or all of the following:
// Choose to match your preferences:
screen_width 1000
screen_height 700

// How the warehouse map will be displayed:
order_color 150 150 60 100
shelf_color 100 100 70 100
text_color 40 0 100 23
text_size 12

// Labels for aisles:
aisle_identifier A
block_left_identifier L
block_right_identifier R
block_top_identifier U
block_bottom_identifier D
start_identifier START
end_identifier END

// Controls for the heuristic:
iterations 3000
runs 5
- Can you make some changes so the program will be more useful to me?
-
Possibly. Send me a description of what you have in mind. If it seems generally useful it will be added to the to-do list.
- How often do you update the software?
-
Bugs are dealt with quickly. Otherwise, the software is updated about once a year.
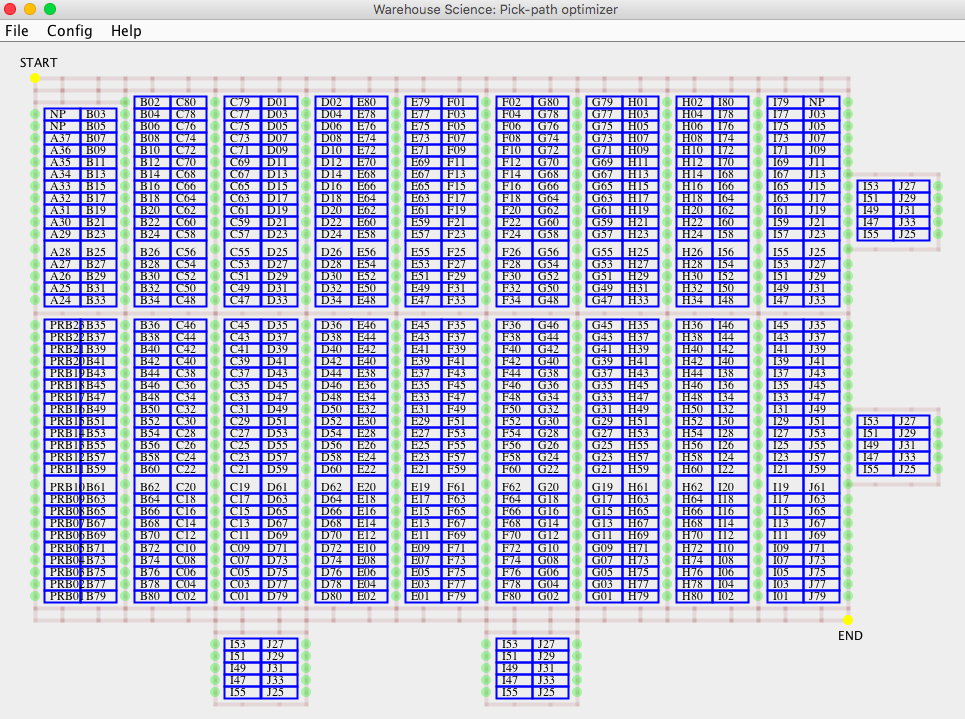
- Why does my warehouse look like this (Figure 3)?
-
You have oriented the drawing so that spreadsheet rows are taller than columns. You should orient your drawing so that longer distances run horizontally.

Figure 3: When drawing your warehouse, choose an orientation that does not squeeze addresses like this.
Recent changes
- Date of last compilation: 2018-12-17
- Improved error alerts and explanations when there is a problem in the warehouse description. (Thanks to Professor Yi Junmin.)
- Fixed a bug that crashed the program if the warehouse drawing included cells at the extreme bottom or extreme right.
To do
- Improve error checking and error messages for the warehouse description.

Figure 4: The warehouse layout can include cross-aisles or islands, but you must specify no more than a single direction (left, right, up, down) from which to access each storage area.